On this screen you will be able to monitor the use of resources made by the Analytics service via graphs, as shown in the image below:
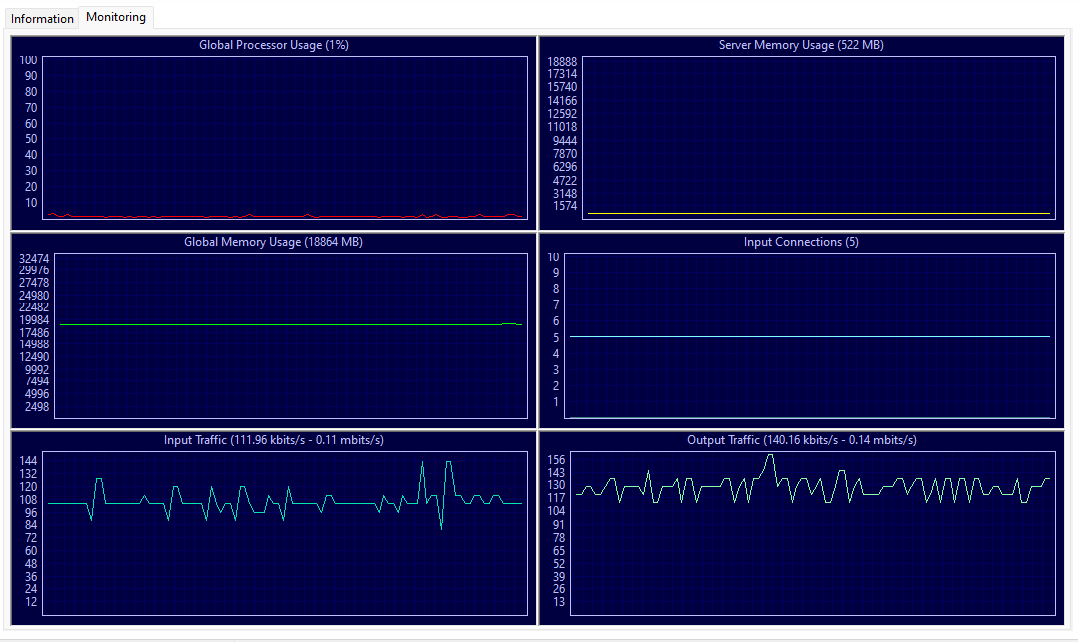
•Global Processor Usage: Displays the global CPU usage of the server where the analytics process is running. This value represents the total usage by all Operating System processes and not just the Analytics Server.
•Server Memory Usage: Displays the memory usage of the Analytics Server process only.
•Global Memory Usage: Displays the total memory usage by all Operating System processes.
•Open Connections: Number of open connections with the Analytics Server.
•Input Traffic: Total data being sent to the Analytics Server by the VMS Servers for processing.
•Output Traffic: Total data being sent from the Analytics Server to the VMS Servers.