In this area of the system, you can monitor how the server is performing, retrieving data such as processor usage, memory, network traffic, etc.
To access this feature, click on the Status item in the Settings Menu, as shown in the figure below:
Once this is done, the server information window will open on the right side, as shown in the figure below:
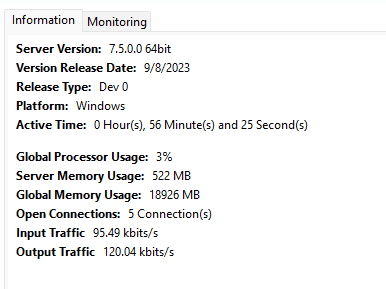
•Server Version: Displays the Analytics Server version.
•Release Date: Displays the release date of this server version.
•Release Type: Displays the release type of this server version.
•Platform: Displays the platform of this server version.
•Global Processor Usage: Displays the global CPU usage of the server where the analytics process is running. This value represents the total usage by all Operating System processes and not just the Analytics Server.
•Server Memory Usage: Displays the memory usage of the Analytics Server process only.
•Global Memory Usage: Displays the total memory usage by all Operating System processes.
•Open Connections: Number of open connections with the Analytics Server.
•Input Traffic: Total data being sent to the Analytics Server by the VMS Servers for processing.
•Output Traffic: Total data being sent from the Analytics Server to the VMS Servers.