By combining the Series and Distribution functions, it is possible to obtain powerful results in the reports.
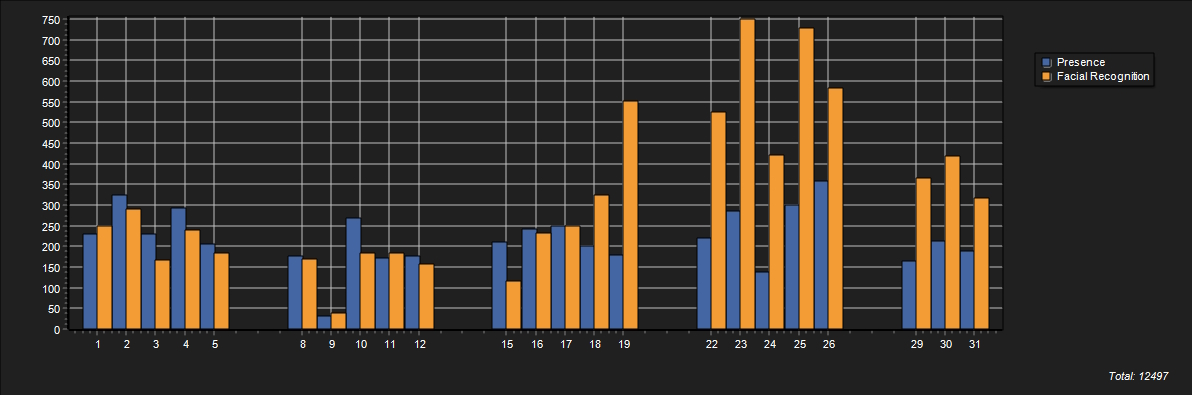
In the figure below, we have set the chart type to Bars and in the Series field we have set the Event Types option and selected the Presence and Facial Recognition events in the filter. This way, the chart will show the sum of all the events in the system on the Y axis.
The Distribution option will show the data in a certain time sample. In the figure below, this distribution is Daily, i.e. we have a sample of all the days of the month (1, 2 ,3 ...31):
To understand how filters work, see the chapter Searching with filters.
The Distribution option is related to the X axis of the chart, more precisely to the sampling time, and has the following functions:
•Hourly: Divides the sampling of records into hours (from 00hrs to 23hrs).
•Daily: Divides sampling into days (from day 1 to day 31).
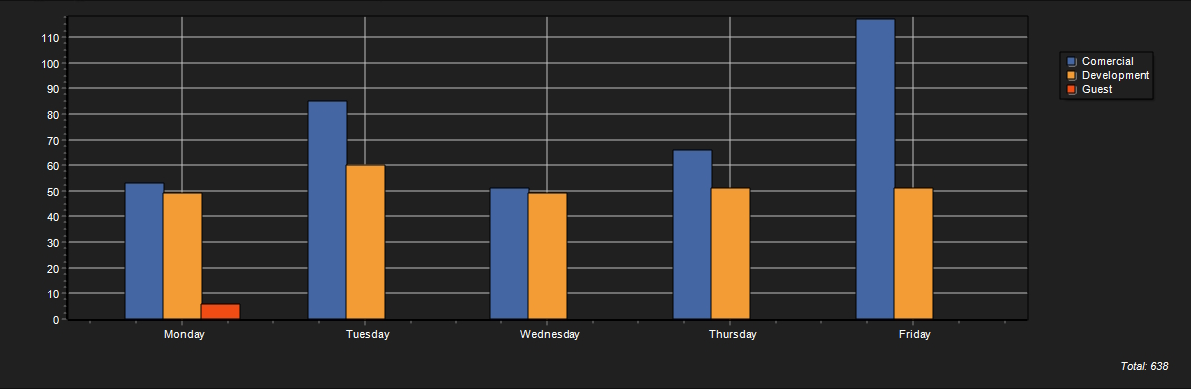
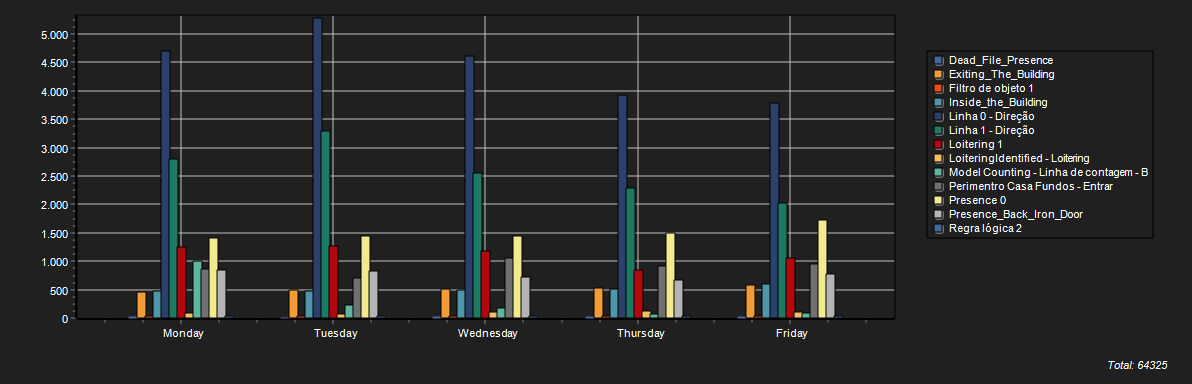
•Weekly: Divides sampling into days of the week (Sunday to Saturday).
•Monthly: Divides sampling into months (from January to December).
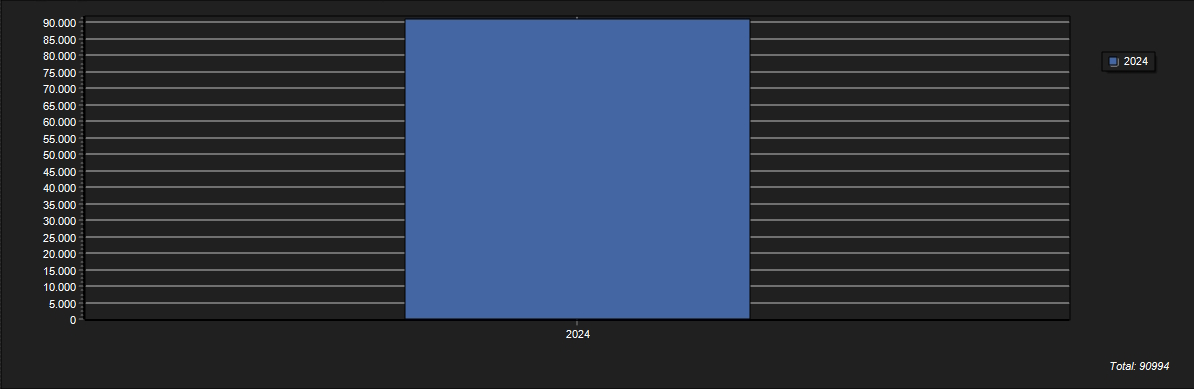
•Annual: Divides the samples into years (years containing records).
The Series option is related to the Y-axis of the graph, more precisely to sampling, and has the following features:
•Events: The event series option will display on the Y axis, the count of the types of events found in the records.

•Object classes: The Object Classes series option will display on the Y axis, the count of objects according to their class.

•Zones: The Zones series option will display the count of records per analytics zone on the Y axis.
•Cameras: The Zones series option will display the count of records per camera on the Y axis.

•Rules: The Rules series option will display on the Y axis, the count of records by rules.
•Days of the week: The Days of the week series option will display the count of all events by days of the week on the Y axis. We recommend using this option in conjunction with Monthly or Annual Distribution.

•Months: The Months series option will display on the Y axis, the count of all events by month of the year. We recommend using this option together with the Monthly or Annual Distribution.

•Years: The Years series option will display on the Y axis, the count of all events by years. We recommend using this option in conjunction with the Annual Distribution.