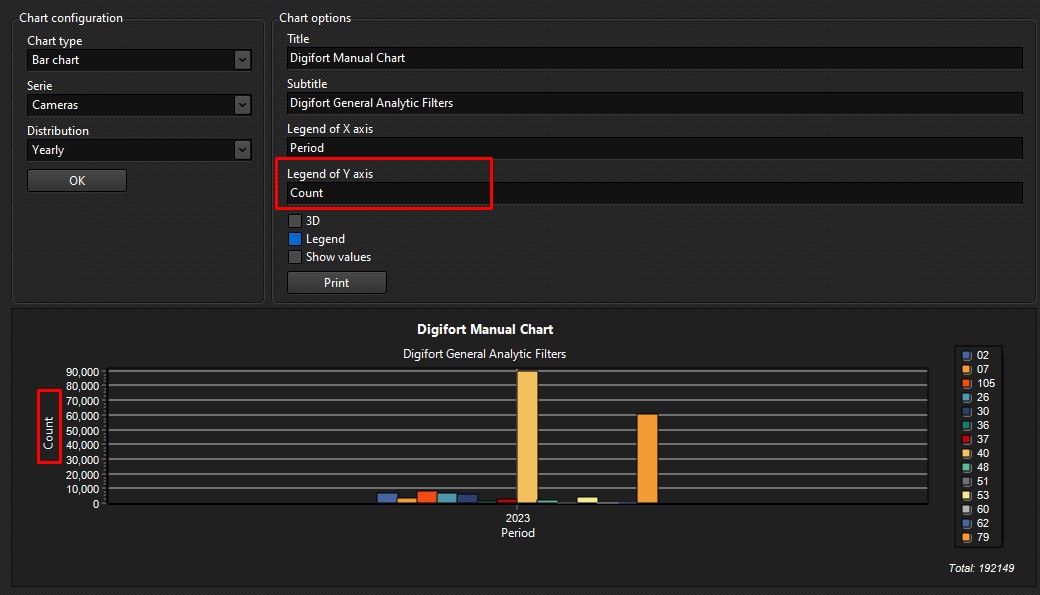
There are some options that allow you to change how the chart is displayed for printing or better visualization.
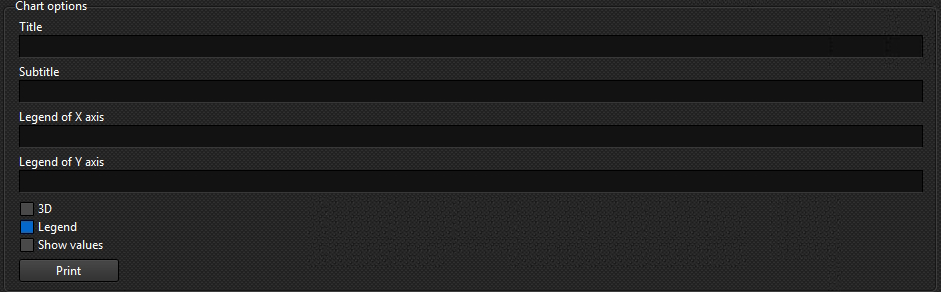
The figure above shows the following functions:
•Title: Adds a title for the chart:

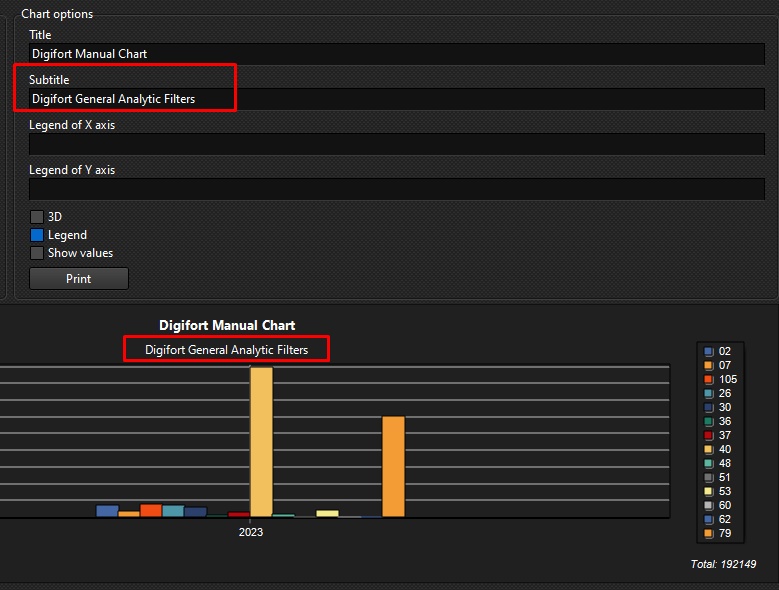
•Sub-Title: Adds a sub-title to the chart:
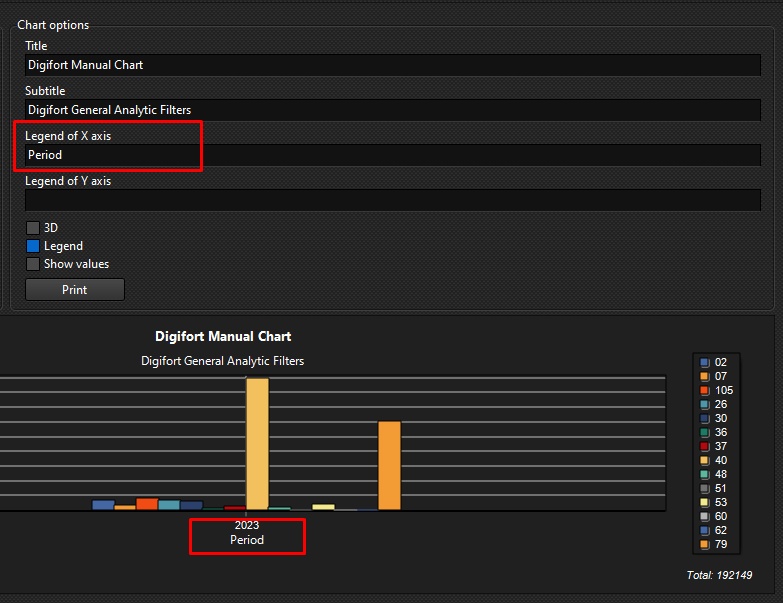
•X-axis legend: Adds a legend for the X-axis:
•Y Axis Legend: Adds a legend for the Yaxis:
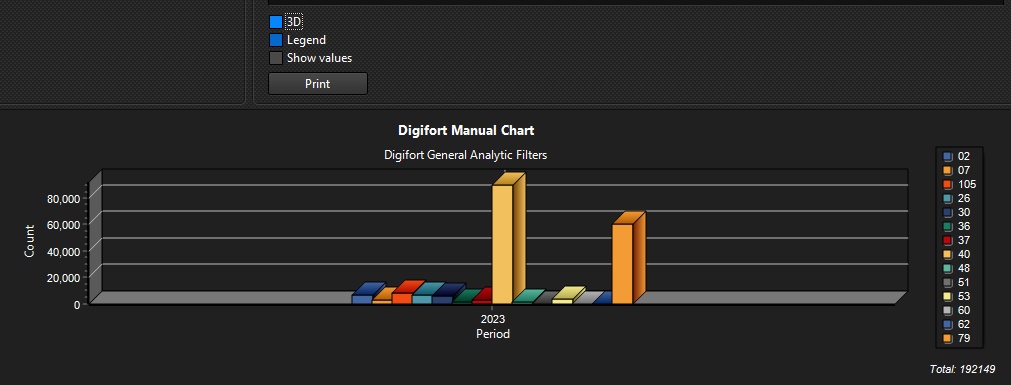
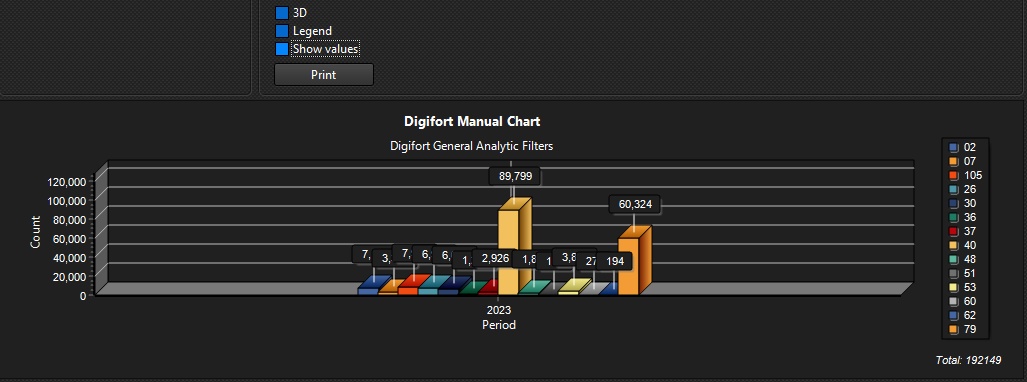
•3D: Option to make the chart look 3D. The image below shows the chart with the option enabled and disabled respectively:
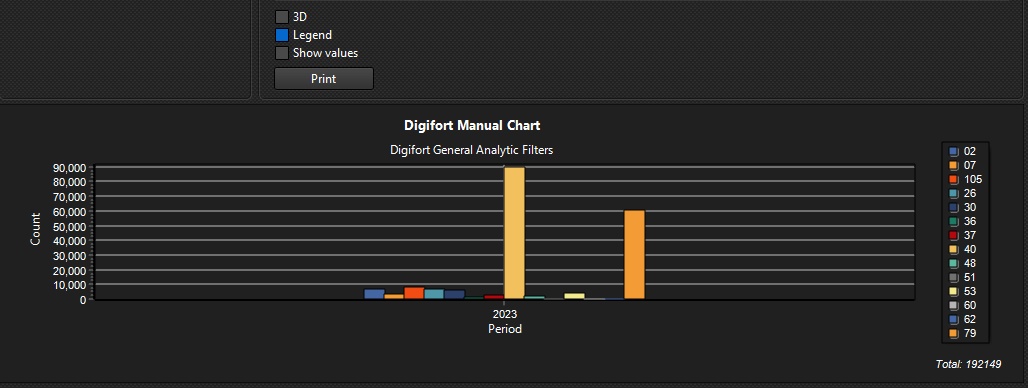
•Legend: Enables or Disables the legend box in the graph. The image below shows the chart with the option enabled and disabled respectively:
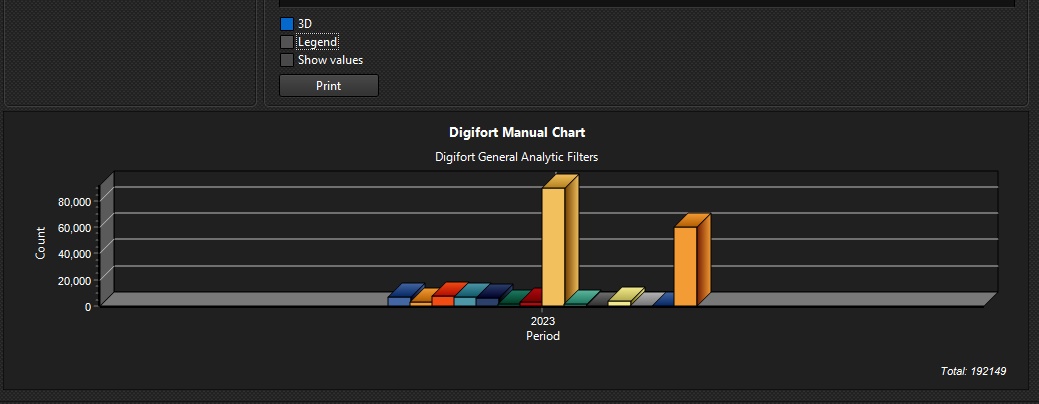

•Show Values: Enables or Disables the values in the chart. The image below shows the chart with the option enabled and disabled respectively:

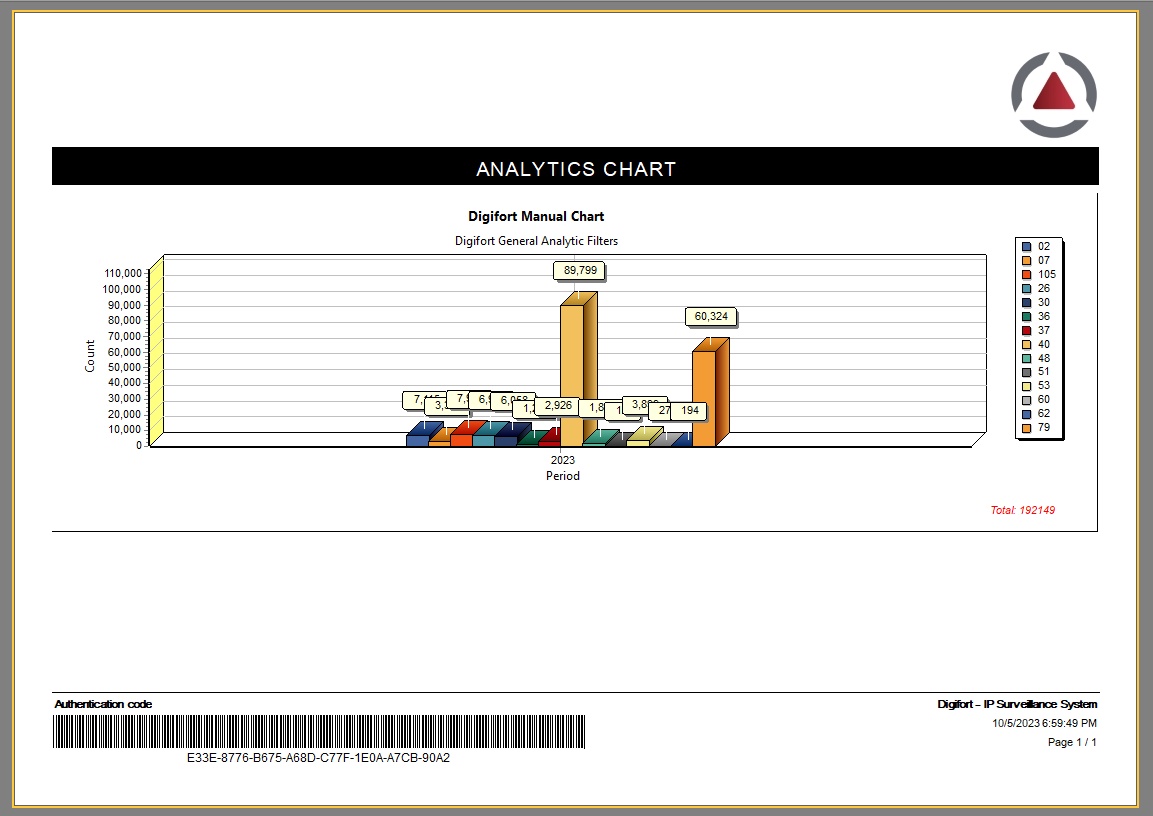
•Print: The Print button opens a screen with the report for printing or which can be saved to disk as shown in the figure below: