The LPR records a level of reading reliability per character. The software generates an average and shows us the degree of reliability per license plate.
Example: License plate ABC1234 had a recognition reliability index of 90%, which is considered a high hit rate.
Reliability indices:
•High: Reliability greater than 90%, license plate letters will be displayed in black:
![]()
•Medium: Reliability between 70% and 90%. License plate letters will be displayed in blue:
![]()
•Low: Reliability less than 70%: License plate letters will be displayed in red:
![]()
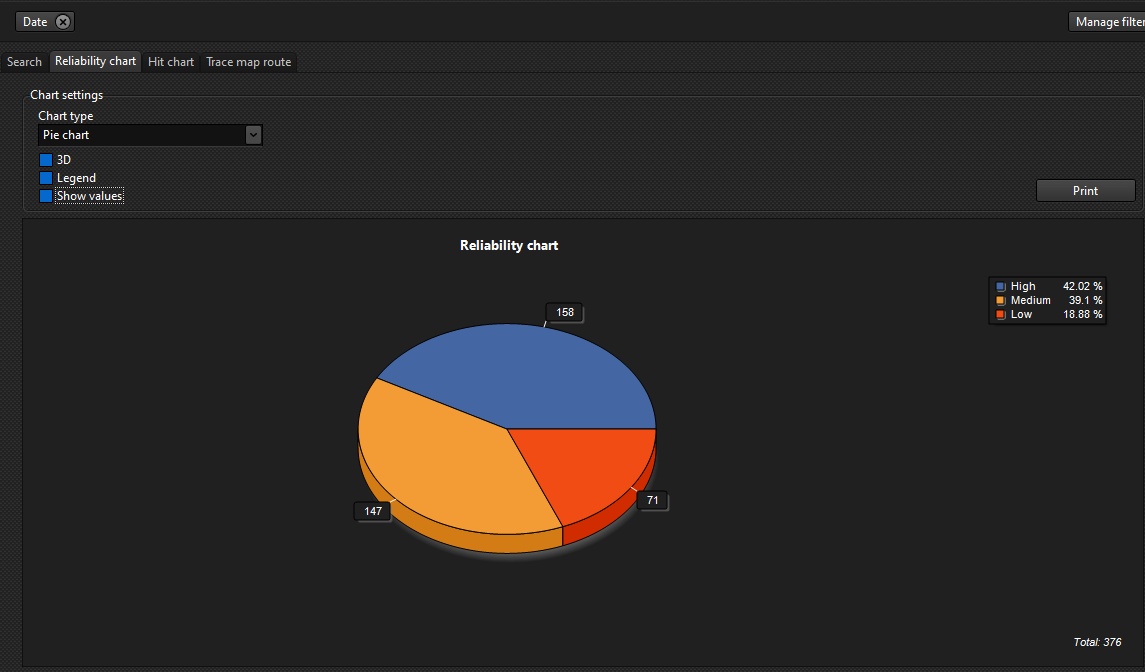
After searching the records of the recognized license plates, you can generate a chart of the reliability index. To do this, click on Reliability Graph as shown in the image below:

•Chart Type: Select the type of chart.
oBar: Bar chart.
oPie: Pie chart.
•3D: Adds a 3D effect to the chart.
•Legend: Adds a legend to the chart values.
•Display Values: Displays the count values in the chart.
•Print: Prints the current chart.
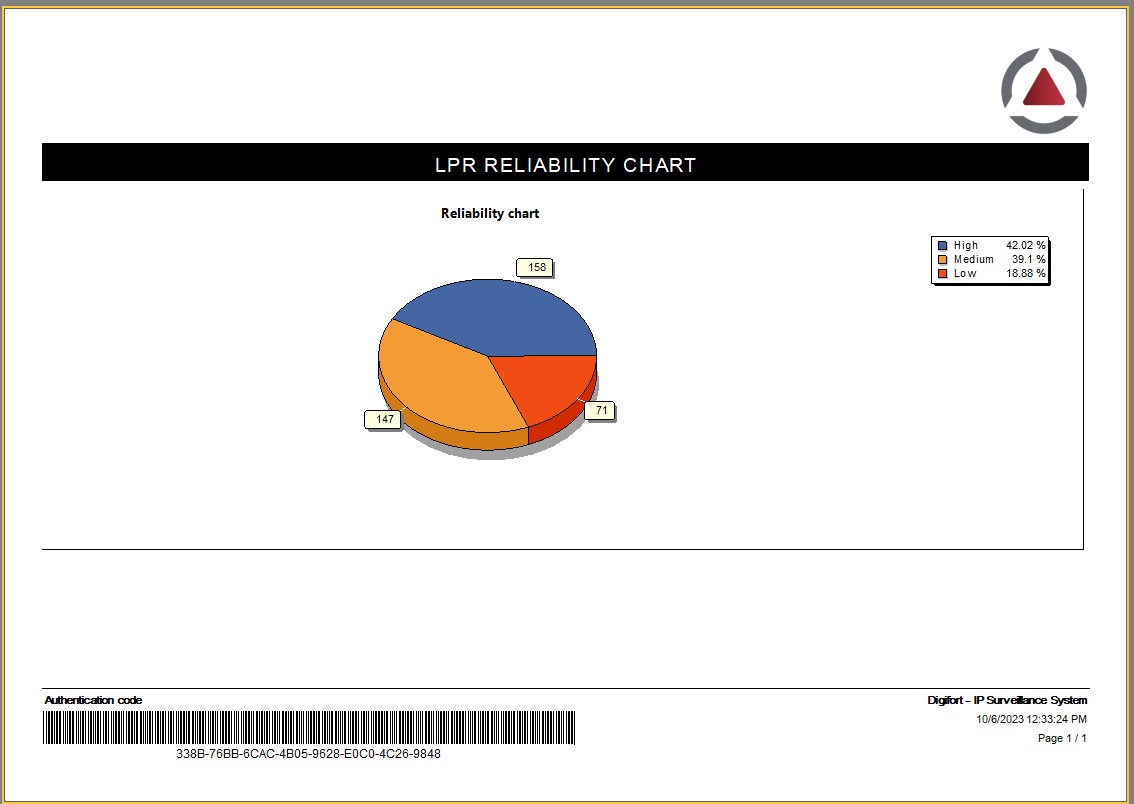
Example pie chart:
The generated chart can be printed or saved by clicking Print: