Analytics reports allow the user to generate a customized report with the analytics records.
You can view the report on screen, print it or export it to PDF and CSV.
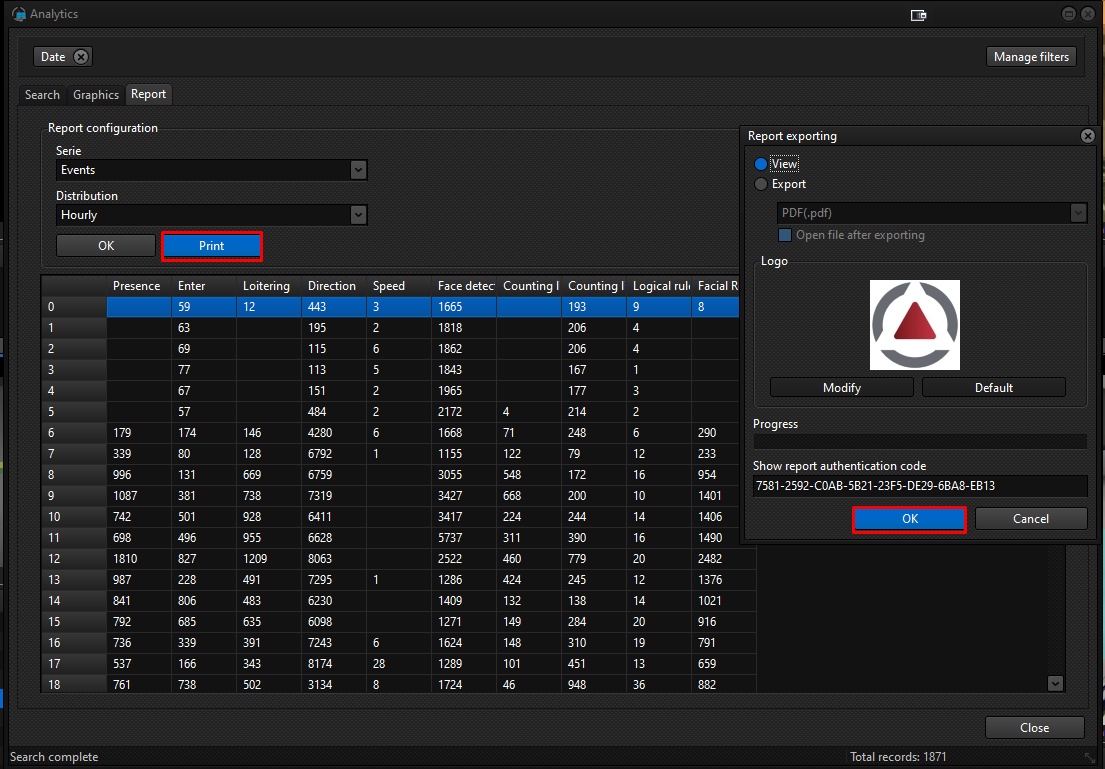
The report screen is accessed via the Report button at the top of the screen, as shown in the image below:

The operation follows the same logic as the graphics screen presented in the previous chapter Generating Charts. You can filter the information using the options in the left-hand sidebar and select the type of series and Distribution you want. Below is an image of a report where the Distribution is Hourly and the Series are Event Types:
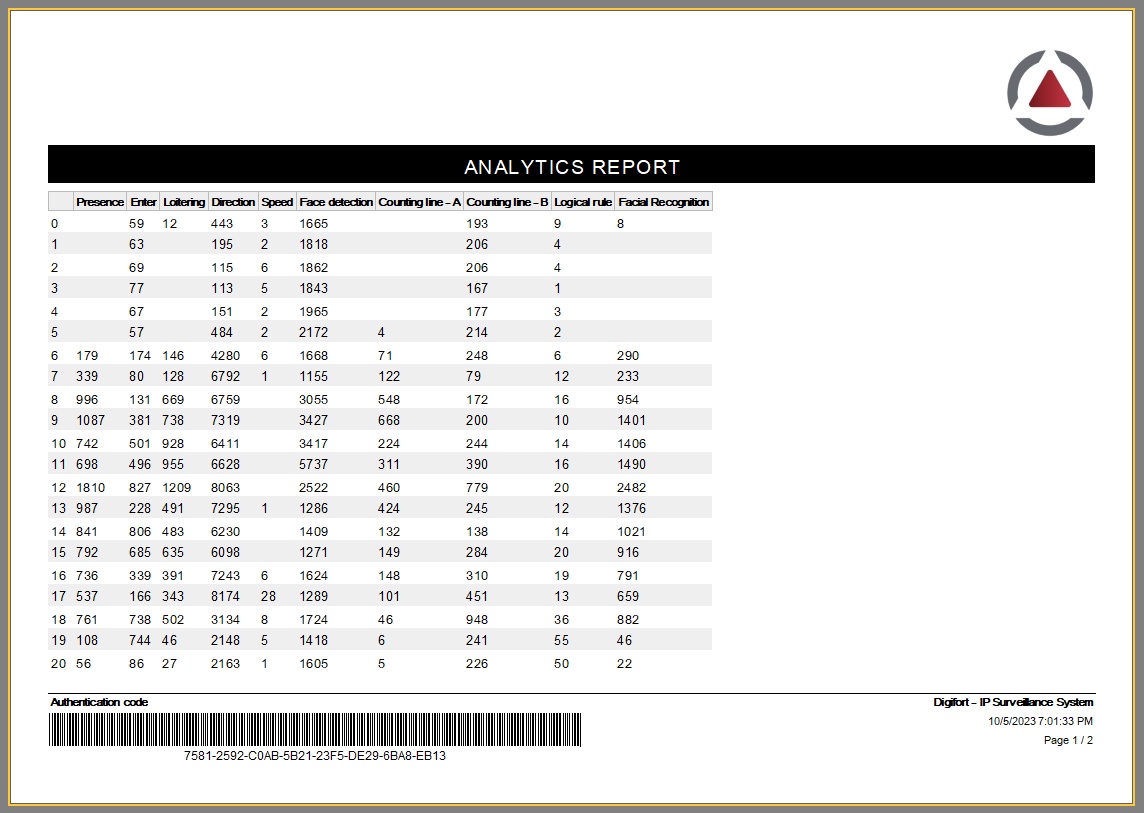
Printed report: