In this area of the system you can monitor how the server is performing, retrieving data such as processor usage, memory, network traffic, etc.
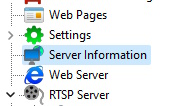
To access this feature, click on the Server Information item in the Settings Menu, as shown in the figure below:
Once this is done, the server information window will open on the right side, as shown in the figure below:

•Server Version: Displays the server version.
•Local Server Time: Displays the server's local time.
•Server Time in UTC: Displays the server time adjusted to UTC.
•Active Time: Displays the time that the server service has been active.
•Global Processor Usage: Displays the global CPU usage of the server where the server process is running. This value represents the total usage by all Operating System processes and not just the VMS Server.
•Server Memory Usage: Displays the memory usage of the VMS Server process only.
•Global Memory Usage: Displays the total memory usage by all Operating System processes.
•Open Connections: Number of open connections with the VMS Server.
•Logged in Clients: Number of individual clients connected to the server.
•Input Traffic: Total data being received by the VMS server (Device Traffic).
•Output Traffic: Total data being sent by the VMS server (To clients).
•Archiving Management: Displays the current state of the archiving system.
•Database Connection Status: Displays the current status of the Database connection.
•Backup Status: Informs whether the database backup is running.
•Progress: Displays the database backup progress.